Please put an active hyperlink to our site (www.rusnature.info) when you copy the materials from this page
Physical Geography of Northern Eurasia
Climate at Present and in the Historical Past
<<< Documentary Sources | Physical Geography Index | Conclusions
>>>
Climate within the Period of Instrumental Meteorological Records
Instrumental meteorological observations commenced in St. Petersburg in 1724 and then
in Moscow in 1731. During the 18th and early 19th centuries, occasional measurements were
taken in Astrakhan, Kazan, Yekaterinburg, Riga, and Solikamsk but there were no continuous
observations until the second half of the 19th century. By 1890, there were over 500
meteorological stations in the Russian Empire. The conventional ground observation network
peaked in the FSU in the 1980s when 14 000 stations were operating. Afterwards, the
combination of growing financial pressure and political instability in such regions as the
Caucasus and Central Asia eroded the network. Historical instrumental records are
infinitely more reliable than non-instrumental observations but these data are not without
limitations. Uncertainties arise from changes in instrumentation, observation
methodologies, and schedules and changes in location of sites and their surroundings.
Particularly strong bias is introduced by urbanization. Folland et al. (1990), Vinnikov et
al. (1990), Groisman et al. (1991), and Nicholls et al. (1995) discuss these problems and
compare homogenized datasets with uncorrected historical instrumental data.
Figure 3.17 depicts composite time-series of temperature anomalies for regions of the
FSU. Climatic variability during the 19th and 20th centuries prior to the 1990s is
discussed by Borisenkov (1992).
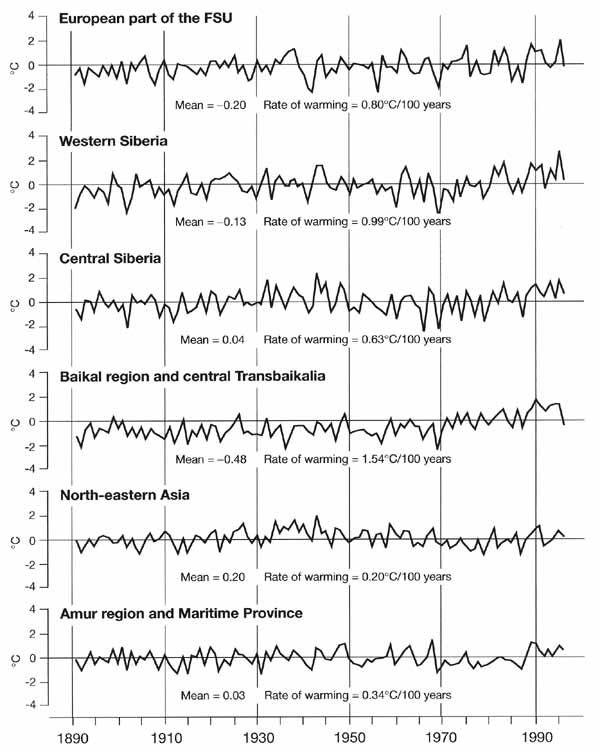
Fig. 3.17 Annual temperature anomalies for regions of the FSU expressed
as deviations from the 1961-90 norm.
Data from the World Meteorological Data Centre, Obninsk, Russia
Although different regions exhibit quite different characteristics of temperature
variability during the 20th century, the most striking feature typical of all Northern
Eurasia is climatic warming at the end of the 20th century. This trend is produced mainly
by the winter warming which is apparent not only in the European territory, Western and
Central Siberia, where climate is controlled by the intensity of zonal flow, but also in
the Baikal region and Transbaikalia which are dominated by the Siberian high in winter.
Sahsamanoglou et al. (1991) have shown that not only has the surface temperature
increased, but the whole of the lower troposphere (1000-500 hPa) has become warmer.
Surface air pressure in the centre of the Siberian high varies and a continuous weakening
of the high has been observed since the 1980s in step with the observed warming. While it
is the Siberian high that controls local winter climate, could the current warming
contribute to its weakening? In the western part of the region, the frequency of
anticyclonic circulation has declined while the frequency and intensity of zonal flow has
increased bringing about record-breaking warm winter weather (Klimenko, 1994a). The storm
tracks have been extending further east too, bringing warmer weather to Western and
Central Siberia (Rogers and Mosley-Thompson, 1995; Rogers, 1997).
Constructing accurate time-series of precipitation is a challenging task especially if
measurements of solid precipitation are involved. These are affected by blown snow and
even small changes in exposure or instrumentation result in significant changes in
captured precipitation. Measurement techniques were changed in the USSR in the 1950s-1960s
and homogeneity of precipitation time-series was disturbed especially in the northern
regions. The history of precipitation measurement and methods of record homogenization in
the FSU are given by Groisman et al. (1991). Producing adequate spatially averaged
time-series is even more difficult because of the meso- or even microscale nature of
precipitation variability, although in the western part of Northern Eurasia this
disadvantage is partly compensated for by a large number of stations. Variability in
precipitation during the period of meteorological observations is discussed by Vinnikov et
al. (1990). The time-series, adjusted to changes in instrumentation, reveal an overall
increase in annual precipitation of 10 per cent between the end of the 19th and the 20th
centuries. However, there are important differences between regions and seasons (Figure
3.18).
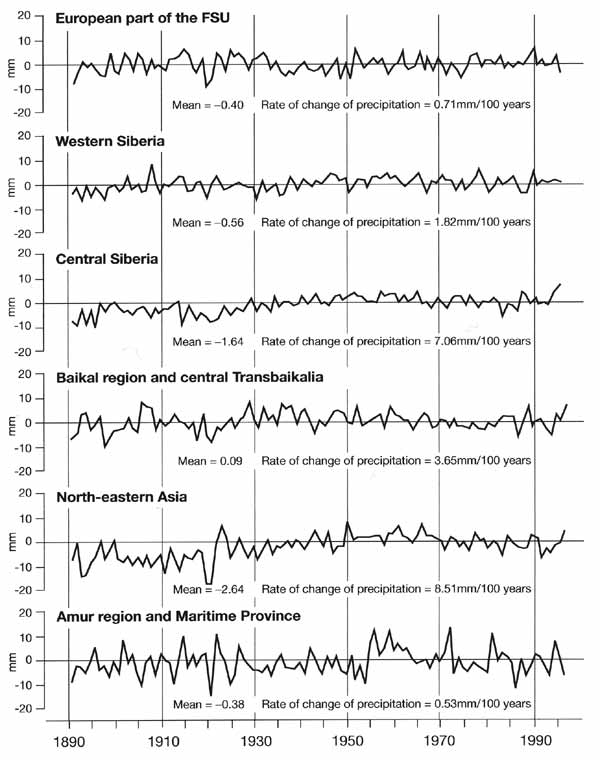
Fig. 3.18 Annual precipitation anomalies for regions of the FSU
expressed as deviation from the 1961-90 norm.
Data from the World Meteorological Data Centre, Obninsk, Russia
Since winter precipitation is controlled by frontal activity, there is generally quite
a good correlation between temperature and precipitation in winter and in most regions a
recent increase in winter precipitation has been observed. Trends in summer precipitation
and its relation to temperature (a factor crucial for agriculture) are more difficult to
detect. There is no close correlation between summer temperature and rainfall and warmer
summers are not necessarily the drier ones. Thus, in central European Russia, the
currently observed summer warming has been accompanied by an increase in summer
precipitation (Klimenko, 19946). Analysis of historical data, both written and
instrumental, has shown that while in the Ukraine 25 per cent of extremely hot summers are
also extremely dry, in central European Russia the probability of such coincidence
declines to just 3 per cent (Lyakhov, 1995b). In order to evaluate whether changes in
summer precipitation are damaging or beneficial for agriculture, historical records of
evaporation are required because it is effective precipitation (defined as the difference
between precipitation and evaporation) that controls moisture availability. Although
measurements of evaporation began in the 19th century, homogeneous time-series only date
back to the 1950s. Since 1951, evaporation has declined in the central East European plain
and Siberia in step with the decreasing diurnal temperature range. No appreciable change
has been observed in Central Asia and Kazakhstan (Nicholls et al, 1995). These trends are
reflected in soil moisture variability. An analysis of observations of soil moisture
content during the period between 1972 and 1985 has not confirmed the alarming trend of
summer desiccation simulated in modelling studies and attributed to rising temperature.
The increase in precipitation is thought to maintain the balance (Vinnikov and
Yeserkepova, 1991). However, summer precipitation has not always been reliable during the
period of instrumental records. The southern regions of the European territory and Western
Siberia, which are the main agricultural areas, suffered from frequent spring and summer
droughts during the last 150 years. Summer droughts were particularly widespread in the
Ukraine between 1880 and 1910, when over 3 5 per cent of the Ukrainian territory
experienced droughts, and during the 1930s and 1960s-1970s (Buchinsky, 1976).
<<< Documentary Sources | Physical Geography Index | Conclusions
>>>
|


