Please put an active hyperlink to our site (www.rusnature.info) when you copy the materials from this page
Physical Geography of Northern Eurasia
Rivers, Lakes, Inland Seas, and Wetlands
<<< Hydrological Measurements |
Physical Geography Index | River Regimes
and Variability in Runoff >>>
Elements of Water Balance
There are approximately 3 million rivers in Northern Eurasia. About 99 per cent of them
are classified as small rivers, that is, they are less than 100 km in length (Domanitsky
et al., 1971). Catchment areas of five rivers exceed 1 million km2 and there
are fifty-two rivers with a catchment area exceeding 100 000 km2 (Table 5.1).
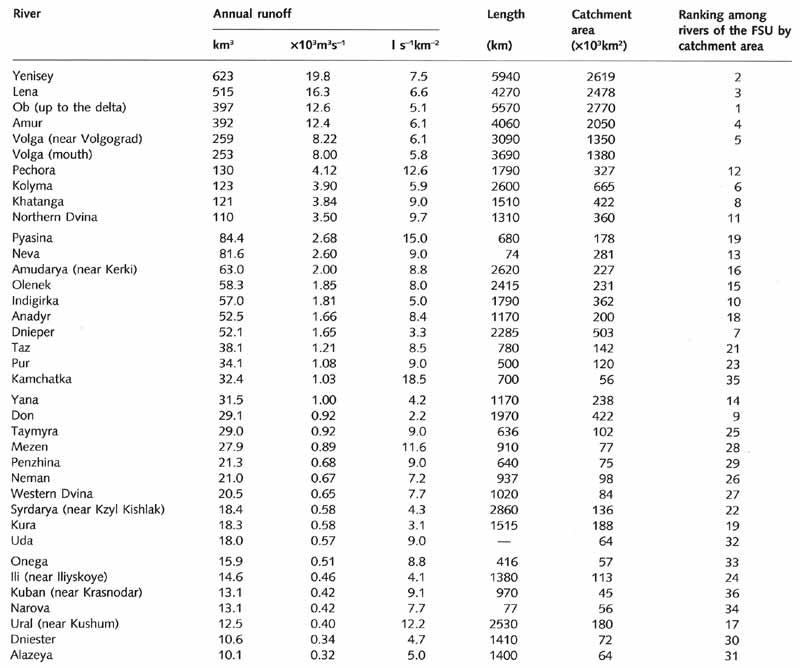
Table 5.1 Characteristics of the largest rivers of Northern Eurasia
With respect to catchment area, the Ob is the largest river in Northern Eurasia and the
fifth largest in the world, while the Volga is the largest European river and the fifth
largest in the FSU. The longest river is the Yenisey whose length is about 6000 km. With
respect to discharge, the Yenisey is the largest in Northern Eurasia and is one of the
world's largest after the Amazon, Congo, Ganges, Brahmaputra, and Yangtze.
Annual discharge of thirty-six main rivers in Northern Eurasia exceeds 10 km3
per year. Most rivers belong to the Arctic basin, which accounts for 54 per cent of the
territory (Figure 5.1).
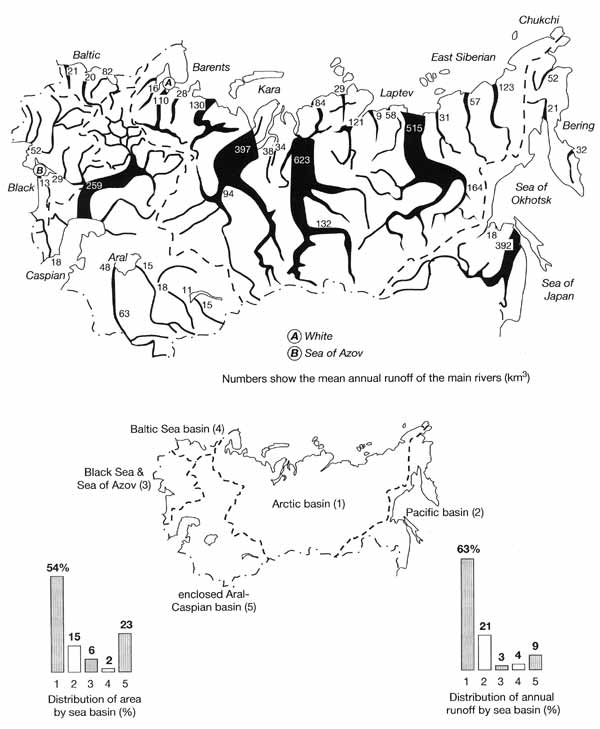
Fig. 5.1 Runoff of the main rivers and its distribution by sea basins.
Modified from Sokolov (1964)
In the Asiatic part, 68 per cent of all catchment area belongs to the Arctic basin. The
second largest is the southern internal basin (the Caspian, Aral, Balkhash, and other
lakes) which covers about 23 per cent of the whole area. In the European territory, 6 7
per cent of all catchment area provides runoff for the rivers flowing south. The rest of
the Eurasian territory is split between the Atlantic (8 per cent) and the Pacific (15 per
cent) basins.
The distribution of water resources across Northern Eurasia (Figure 5.2) is very uneven
and reflects many features of distribution of two other components of the water balance,
precipitation and evaporation (Figures 5.3 and 5.4).
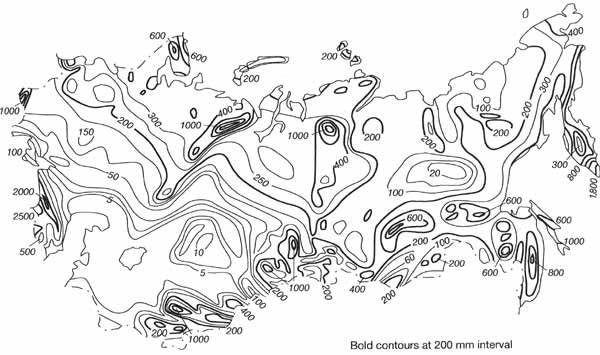
Fig. 5.2 Mean annual runoff (mm). Modified from Sokolov (1981)
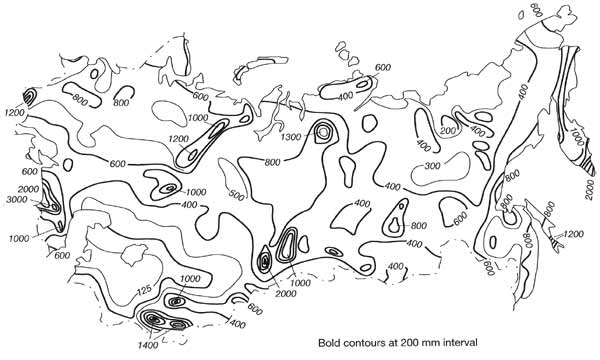
Fig. 5.3 Mean annual precipitation (mm). Modified from Sokolov (1981)
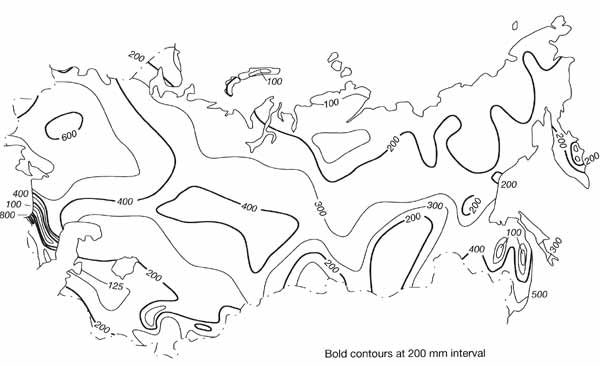
Fig. 5.4 Mean annual evaporation (mm). Modified from Sokolov (1981)
The runoff coefficients generally decrease southwards from 0.6 in the tundra to 0.4 in
the taiga, 0.1-0.2 in the forest-steppe and to less than 0.1 in the dry steppe,
semi-desert, and desert zones. However, the runoff coefficient also depends on such
non-climatic factors as topography, geology, presence of permafrost, type and condition of
soil, and vegetation. Because of these influences (permafrost in particular) and a lack of
thermal resources, runoff coefficients on the Siberian plains are often higher than in the
European territory although precipitation there is lower.
Latitudinal zonation is expressed clearly in the distribution of the equivalent depth
of river runoff. In the tundra and taiga the annual equivalent depth of river runoff
ranges between 250 mm and 300 mm, in the steppe it varies between 20 mm and 100 mm, and it
decreases almost to zero in deserts. The equivalent depth declines towards the centre of
the continent in line with increasing aridity and in the Asiatic part it is generally
lower than in the European territory. Altitudinal effects are also important. Because
precipitation increases with altitude and evaporation declines, mountainous regions have
higher runoff than the plains. In particular, in the western Caucasus, the equivalent
depth of runoff locally exceeds 3000 mm in the foothills and increases with altitude.
Latitudinal zonation and vertical differentiation are evident in the distribution of
surface runoff and subsurface flow and also in their relation to other components of the
water balance. In the European part, surface runoff varies between 200 mm and 250 mm in
the north and is less than 10 mm in the south, while subsurface flow declines from 100 mm
in the north to nearly zero in the south. The spatial distribution of subsurface flow as a
proportion of total discharge is illustrated in Figure 5.5.
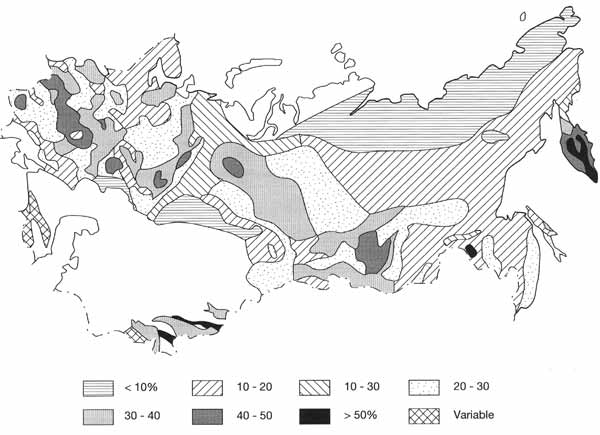
Fig. 5.5 Annual subsurface flow as a percentage of total annual runoff.
Modified from Popov (1968)
Because of permafrost, the contribution of subsurface flow is much lower in the Asiatic
part, and particularly in Eastern Siberia, than in the European territory. The more recent
analysis of water balance has shown that the proportion of subsurface flow in total
discharge, shown in Figure 5.5, is in fact higher and can exceed 60 per cent in the
forested regions where surface runoff is small (Koronkevich, 1990).
Comparison of the hydrological characteristics of Northern Eurasia with those of the
other parts of the world shows that Northern Eurasia has a poor moisture supply. On
average, it receives 500 mm of precipitation per annum, while Europe receives 790 mm,
North America 756 mm, South America 1600 mm, Africa 740 mm, and Australia and Oceania 791
(UNESCO, 1978). The equivalent depth of runoff is 67 per cent of the world average while
sustainable flow of an underground origin is only 51 per cent (Lvovich, 1974). Only in
Africa are lower values of runoff observed. The moisture balance, a characteristic of soil
moisture resources defined as a difference between precipitation and surface runoff, is
only 57 per cent of the global average, which partly explains the low agricultural
potential of Northern Eurasia. There are, of course, important regional differences in
water balance which are illustrated by Table 5.2.
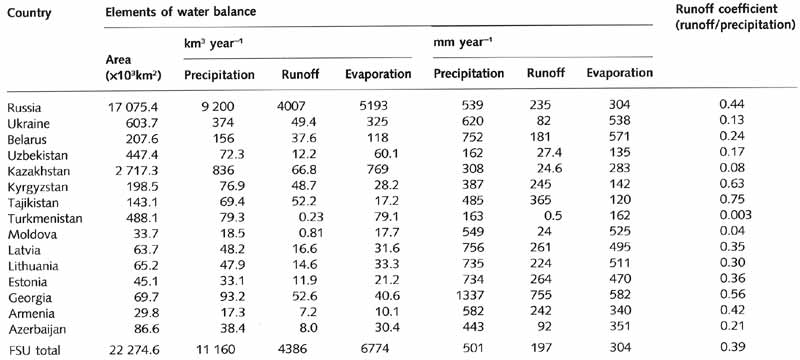
Table 5.2 Water balance of the countries of the FSU
<<< Hydrological Measurements |
Physical Geography Index | River Regimes
and Variability in Runoff >>>
|


